
Page 50 - Annual Report_21-22
P. 50
MATERIALS CHEMISTRY
Design of direct white light emitting single phase materials
The Zinc and magnesium co-doped SCO was synthesized of co-doped ions. The decrease in fluorescence intensity
via hydrothermal synthesis. XRD data showed the phase at higher concentrations of doped ions may be due to
purity with the orthorhombic phase SCO and Pbam space possible other interatomic interactions. In addition, we
group, Figure below. The absolute luminescence quantum observed the spectrum is broadened, and red-shifted as
yield calculated is 49.5% for SCO-3. With a further increase compared to pure SCO.
in doping concentration, the fluorescence intensity The excitation dependent PL spectra of SCO and SOC-3
decreases gradually. We also found the decreasing suggest that there is no change in spectral shape and also
trend of PL quantum yield. The main cause of tuning the no spectral shift observed. Moreover, a single PL lifetime
luminescence of phosphors is the interaction of a small obtained (when recorded at ~445 and ~480 nm) suggests
concentration of impurity ion/s with the regularly arranged that only one radiative CT excited state exists. The doping
luminescence structures. This interaction triggers the concentration has minimal effect on the PL lifetime of SCO.
delocalization of excitation energy and is responsible This suggests the excited CT state must remain the same
for the modification of spectra shape and position. The as for SCO. However, reasonably long PL decay times, e.g.
enhancement of CT emission in co-doped SCO-3 may be 40 µs for SCO can be attributed to the long-lived CT triplet
due to the larger electronegativity and the smaller radius state, from which the emission occurs, Figure above.
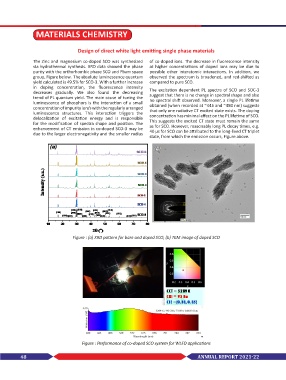
Figure : (a) XRD pattern for bare and doped SCO, (b) TEM image of doped SCO
Figure : Performance of co-doped SCO system for WLED applications
48 ANNUAL REPORT 2021-22