
Page 57 - Annual Report_21-22
P. 57
Role of disorder toward different properties and enhancing energy storage efficiency
in (BaCa)TiO3 ceramics
The excellent dielectric, ferroelectric, piezoelectric, phase formation. Two Raman bands at 122 cm and 169
-1
and chemical stability of Barium titanate (BT) makes cm validate the disordering of O-Ti-O bonds and the
-1
3+
it a suitable candidate for many applications such as presence of Ti state respectively in all the compositions.
2+
4+
multilayer ceramic capacitors, PTCR ceramics, optical data Signature of diffuseness, partial substitution of Ca for Ti
storage devices, ultrasonic transducers, semiconductors, along with Ba was observed for BCT-5. Partial substitution
of Ca for Ti helps in generating oxygen vacancies and
2+
4+
and thermal energy harvesters. In Ca doped BT (BCT) Ca disordering in the system resulting in diffuse/broad phase
2+
occupying the Ba site of BT raises T for a lower Ca transition without destroying the dielectric anomaly. The
2+
2+
T-C
concentration (0 ≤ x ≤ 0.08), whereas Ca2+ occupying enhanced recoverable energy density of 224.3 mJ/cm
3
the Ti4+ site decreases TT-C dramatically close to room and storage efficiency of 85% was found to be maximum
temperature. As a disorder associated with bonds, for BCT-3, making it suitable for high energy density
structure and composition therefore it directly affects the capacitors. Disordering also modified indirect optical
electronic state of the material and hence modulates all bandgap, which varies between 1.97 -2.24 eV and can
the properties associated with structure and electronic be useful for optoelectronic devices. Therefore, disorder
state which modifies the performance of any system. and a defect in the local Ti atom environment not only
modify structural, dielectric, ferroelectric, piezoelectric
BCT ceramics were prepared by replacing Ba with Ca with properties, etc., but also enhance the energy storage
different concentrations using modified synthesis process efficiency and narrow the optical bandgap and can be
to introduce disorder in the system. XRD, Raman confirms used for various industrial applications.
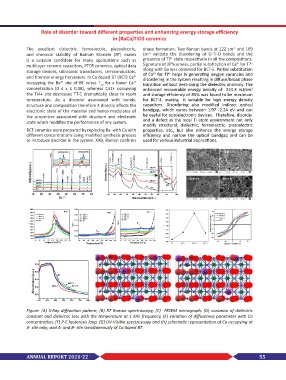
Figure: (A) X-Ray diffraction pattern, (B) RT Raman spectroscopy, (C) FESEM micrograph, (D) variation of dielectric
constant and dielectric loss with the temperature at 1 kHz frequency, (E) variation of diffuseness parameter with Ca
concentration, (F) P-E hysteresis loop, (G) UV-Visible spectroscopy and (H) schematic representation of Ca occupying at
A- site only; and A- and B- site simultaneously of Ca doped BT.
ANNUAL REPORT 2021-22 55