
Page 73 - Annual Report_21-22
P. 73
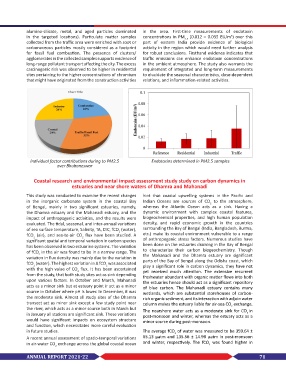
alumino-silicate,  metal,  and  aged  particles  dominated   in  the  area.  First-time  measurements  of  endotoxin
            in  the  targeted  locations).  Particulate  matter  samples   concentrations in PM  (0.012 – 0.035 EU/m ) over this
                                                                                                   3
                                                                                2.5
            collected from the traffic area were enriched with soot or   part of eastern India  provide evidence  of biological
            carbonaceous particles mostly considered as a footprint   activity in the region which would need further analysis
            for  fossil  fuel  combustion.  The  presence  of  clusters/  for robust conclusions. Firsthand evidence indicates that
            agglomerates in the collected samples supports evidence of   traffic  emissions  can  enhance  endotoxin  concentrations
            long-range pollutant transport affecting the city. The excess   in the ambient atmosphere. The study also warrants the
            carcinogenic risk was observed to be higher in residential   requirement of integrated and long-term measurements
            sites pertaining to the higher concentrations of chromium   to elucidate the seasonal characteristics, dose-dependent
            that might have originated from the construction activities   relations, and inflammation-related activities.


              Individual factor contributions during to PM2.5     Endotoxins determined in PM2.5 samples
                         over Bhubaneswar


               Coastal research and environmental impact assessment study study on carbon dynamics in
                                estuaries and near shore waters of Dhamra and Mahanadi

            This study was conducted to examine the recent changes   hint  that  coastal  upwelling  systems  in  the  Pacific  and
            in  the inorganic carbonate system  in  the coastal Bay   Indian  Oceans are  sources  of  CO  to the atmosphere,
                                                                                           2
            of  Bengal,  mainly  in  two  significant  estuaries,  namely,   whereas  the  Atlantic  Ocean  acts  as  a  sink.  Having  a
            the Dhamra estuary and the Mahanadi estuary, and the   dynamic environment  with complex coastal features,
            impact of anthropogenic activities, and the results were   biogeochemical  properties,  and  high  human  population
            evaluated. The tidal, seasonal, and inter-annual variations   density,  and rapid  economic  growth in the  countries
            of sea surface temperature, Salinity, TA, DIC, fCO  (water),   surrounding the Bay of Bengal (India, Bangladesh, Burma,
                                                    2
            fCO   (air),  and  sea-to-air  CO   flux  have  been  studied.  A   etc.) make its coastal environment vulnerable to a range
                                    2
               2
            significant spatial and temporal variation in carbon species   of anthropogenic stress factors. Numerous studies have
            has been observed in two estuarine systems. The variation   been done on the estuaries draining in the Bay of Bengal
            of fCO  in the air was found to be in a narrow range. The   to  characterize  their  carbon  biogeochemistry.  Though
                  2
            variation in flux density was mainly due to the variation in   the  Mahanadi  and  the  Dhamra  estuary  are  significant
                                                              parts of the Bay of Bengal along the Odisha coast, which
            fCO  (water). The highest variation in Δ fCO  was associated   play a significant role in carbon dynamics, they have not
               2
                                              2
            with the high value of CO  flux. It has been ascertained   yet  received  much  attention.  The  extensive  recurrent
                                  2
            from the study, that both study sites act as sink depending   freshwater abundant with organic matter flows into both
            upon  various  factors.  In  October  and  March,  Mahanadi   the estuaries hence should act as a significant repository
            acts as a minor sink but at estuary point ir act as a minor   of  blue  carbon.  The  Mahanadi  estuary  contains  many
            source in October where pH is lower. In December, it was   wetlands,  which  are  substantial  storehouses  of  carbon-
            the moderate sink. Almost all study sites of the Dhamra   rich organic sediment, and its interaction with adjoin water
            transect act as minor sink except a few study point near   column makes the estuary liable for air-sea CO  exchange.
                                                                                                    2
            the river, which acts as a minor source both in March but   The nearshore water acts as a moderate sink for CO in
            in January all stations are significant sink. These variations   post-monsoon and winter, whereas the estuary acts as a
                                                                                                          2
            would  have  significant  impacts  on  ecosystem  structure   minor source during post-monsoon.
            and function, which necessitates more careful evaluation
            in future studies.                                The average fCO  of water was measured to be 359.64 ±
                                                                           2
            A recent annual assessment of spatio-temporal variations   65.13  µatm  and 135.56  ± 14.98  µatm  in post-monsoon
            in air-water CO  exchange across the global coastal ocean   and  winter,  respectively.  The  fCO  was found  higher in
                                                                                          2
                         2
            ANNUAL REPORT 2021-22                                                                               71